

Entanglement is the most enigmatic phenomenon of quantum theory. It is also what creates the most striking differences between quantum mechanics and classical theories. Entanglement describes the correlation between events at different locations and is often in conflict with our intuition.
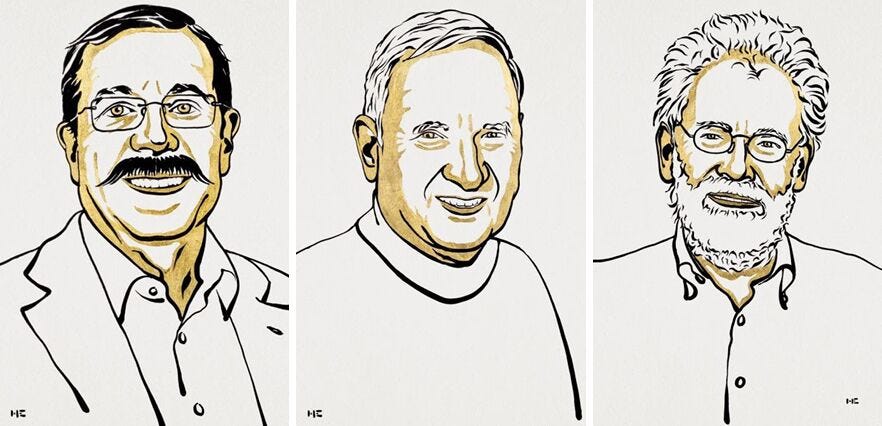
In 2022, the Nobel Prize was awarded to the team of scientists who experimentally demonstrated quantum correlations and who provided evidence that these correlations could not be explained by classical theories [1].
John Bell’s work in the 60s and 70s gave birth to a metric that quantifies the strength of the correlation between entangled particles. Based on our everyday assumptions, this correlation should be bound by a maximum value. However, both theoretically and experimentally, we observe that nature goes beyond this bound. In this post, we will explain the metric and the intuitive assumptions behind it.
Coin game
To understand the metric for quantum correlations, imagine a simple game with two players and one dealer. The game involves coins that the dealer distributes to the players. The coins are hidden under a cup, and the players can score points based on the orientation of the coins they select. The dealer can be neutral, friendly, or malevolent towards the players. Let’s have a look at the rules in detail:
- There is one dealer and two players. The players form a team. The dealer and players are not allowed to agree on a strategy upfront.
- For each turn, the dealer gives two coins to each player. These coins are covered under a cup and invisible to both players.
- Each player gets a larger coin (for instance, a ‘Two euro coin’) and a smaller coin (for example, a ‘Single euro coin’). We call these S or T for short.
- When the players receive the cup covering the coins, they select one coin and note whether it is heads-up or tails-up. The other coin remains hidden under the cup.
- Throughout the game, the dealer has to ensure there are as many cases with the coins heads up as with the coins tails up. The players must select the T coin as often as the S coin. For every individual player, the result will look totally random.
- Per turn, the players can win a cent or lose a cent.
- The score in the game is calculated like this: If, in a turn, the players find the same orientation, they win one cent, except in the situation where both players select the T coin. In that case, they win if their results are different. If the players do not win, they lose and must pay a cent.
At first glance, it looks like the players with a friendly dealer can win up to one cent per turn, but in reality, their outcome is limited to half a cent. Luckily, with a malevolent dealer, their loss will not be one cent per turn but also limited to half a cent. How can we understand this limitation?
We can easily calculate the maximum score per turn if we assign a 1 to heads up and a -1 to tails up. If they both see heads up or both see tails up, the product of their results is always 1, either 1×1 =1 or -1x-1 = 1. If they see a different coin orientation, the product will always be -1 (-1×1 = -1 or 1x-1 = -1). So, the payout at the end of the game will be the number of turns played times the average outcome per turn (either 1 or -1).
The players must randomly select the coin they will look at (the T or the S coin). So, over the complete game, there will be as many turns where they select TT, ST, ST, or TT (here, the first letter in the pair indicates the first player’s choice and the second letter is the selection of the second player). The payout is the product of their outcomes for each turn, either 1 or -1. So, for the total game, the result is 25% of the average for each combination. We denote the average by the symbol <>, so the average value of the outcomes TT is written as <TT>. With that notation, we have:
Payout = 25% <SS> + 25% <ST> + 25% <TS> – 25% <TT>
Let’s look at an example to make this more clear. Imagine the dealer always has a strategy to give one player both coins head up and the other both coins tail up. He randomly varies which player gets the heads up and which player the tails up, so it still appears random for every player. In this case, the player will always lose one cent, except when they both select T. For that combination, they would win one cent. So the expected payout would be 25% x +1 + 25% x -1 + 25% x -1 – 25% x -1 = -0.50 cent. So, on average, the players would lose half a cent per turn. This is a strategy for a malevolent dealer!
A friendly dealer can increase everyone’s chances of winning in a coin game. One strategy is for the dealer to place all four coins in the same orientation, either all heads up or all tails up. This way, the players will win one cent in three out of four situations. They will only lose when they both select T. So the expected payout would be 25% x 1 + 25% x 1 + 25% x 1 – 25% x 1 = +0.50 cent. With this friendly dealer, the players would win half a cent per turn.
A neutral dealer would distribute coins with a completely random orientation. Any combination of heads up and tails up would be equally likely. In this case, the average value for all four combinations (SS, ST, TS, and TT) is zero, and on average, the players would be as likely to lose or to win a cent. On average, their gain would be 0 cents.
Maximum and minimum wins
How can we assess the maximum and minimum outcomes for this game? The logic for this is relatively straightforward:
Payout = 25% <SS> + 25% <ST> + 25% <TS> — 25% <TT>
Payout = 25% * (<SS> + <ST> + <TS> -<TT>).
We can use the fact that the sum of averages equals the average of the sum so that we find:
Payout = 25% x (<SS + ST + TS — TT>).
Grouping the terms where the first player makes the same choice leads to:
Payout =25% x (<Sx(S +T) + Tx(S — T)>).
Earlier, we assigned a 1 to head up and a -1 to tail up. So, for the second player, we have two options: S and T have the same orientation, and S–T is equal to 0, or S and T have the opposite orientation, and S+T is zero. So, in any case, for each turn, the value of Sx(S +T) + Tx(S — T) equals 2 or -2. There is no other option for any individual turn. If we know that the value of SS + ST + TS — TT is either 2 or -2 for each turn, we also know that the average value cannot exceed these values. So we have proven that <SS> + <ST> + <TS> -<TT> is always larger than -2 or smaller than 2 (including both boundary values).
-2 ≤ (<SS> + <ST> + <TS> -<TT>) ≤ 2
This equation is also known as the CHSH inequality. It is named after its creators, John Clauser, Michael Horne, Abner Shimony, and Richard Holt, the first of whom won the Nobel Prize in 2022 [2].
The explanation presented above is based on Nicolas Gisin’s explanation in his book Quantum Chance [3]. We follow Jeffrey Bub’s explanation in Bananaworld [4] for the notation T and S.
Reality and locality
What assumptions did we make to arrive at this inequality? These are basic assumptions, making it more interesting to discover that nature violates this inequality.
- We assumed the coins had a fixed value even before the players looked at them. Therefore, we can still give a definite value to the coins we left covered in a turn. This assumption we call reality. We assume the values are real, independent of whether we measure them.
- We also assume that the first player’s observation is independent of the second player’s choice. We consider the two players’ observations independent (except for any relation created by the dealer). This assumption we call locality.
Together, these assumptions form the basis for a worldview that has been with us until quantum physics emerged in the first half of the last century. We realize that the short and popularized description of the assumptions above does not do justice to the debate still entertained in the physics community. If you want to know more, we can recommend the recent article by Sabine Hossenfelder, where she tries to clear up some of the (semantic) confusion [5].
Now, we have seen that based on very intuitive principles, the payout for this simple coin game is limited to 0.50 cents per round, averaging over a game with many rounds. The principles are reality and locality. To come structurally to a higher payout would require cheating. However, to the surprise and disbelief of many scientists, it is experimentally proven that nature can break these limitations. If we take two photons that we send to different locations and randomly select to perform a measurement T or S on these photons, the payout can be up to 0.70 cents per round!
The CHSH correlation is the perfect metric to quantify how surprising an experiment’s outcome should be. It is simple enough to be applied to a coin game and rich enough to lead to speculation on superquantum theories among scientists. In the next post, we will address Alain Aspect’s experiments on the CHSH inequality for entangled photons. In the meantime, please leave your comments and builds.
- advanced-physicsprize2022–4.pdf (nobelprize.org)
- J. F. Clauser, M. A. Horne, A. Shimony, and B. A. Holt, “Proposed Experiment to Test Local Hidden-Variable Theories” Phys. Rev. Lett. 23, 880 (1969).
- “Quantum Chance. Nonlocality, Teleportation and Other Quantum Marvels” Springer International Publishing Switzerland (2014). https://doi.org/10.1007/978-3-319-05473-5
- J. Bub, “BananaworldBananaworld: Quantum Mechanics for Primates,”
Oxford University Press (2016) - S. Hossenfelder, “Quantum Confusions, Cleared Up (or so I hope),” arXiv:2309.12299v1

Plaats een reactie